

monit-agent is installed and started, the platform automatically displays the hosts, databases, and middleware objects that the Agent can diagnose.
Why monit-agent is needed
Traditional observability data usually includes metrics, logs, traces, and alert events. These data types help you understand what happened, but real troubleshooting often requires checking the live environment, for example:- Which processes on the current machine are using high CPU or memory.
- Whether a port, domain, or service can be reached from the target machine.
- Whether disks, mount points, network interfaces, or connection counts are abnormal.
- MySQL variables, connection state, key metrics, or read-only SQL query results.
- Redis memory, hit rate, slow logs, or read-only command results.
- PostgreSQL connection activity, lock waits, slow queries, or read-only SQL query results.
- MongoDB replica set status, current operations, or read-only management command results.
- Kafka broker status, consumer lag, topic details, and group details.
- Elasticsearch cluster health, node metrics, index statistics, and shard allocation.
monit-agent is designed for this scenario.
In AI-SRE scenarios, you can think of the LLM as the diagnostic brain, and monit-agent as the execution endpoint deployed in your environment. After a user asks a question in natural language, the LLM understands the question, selects suitable diagnostic tools, and explains the result. monit-agent executes controlled queries near the target host or target service and returns structured results to the system.
Technical Architecture
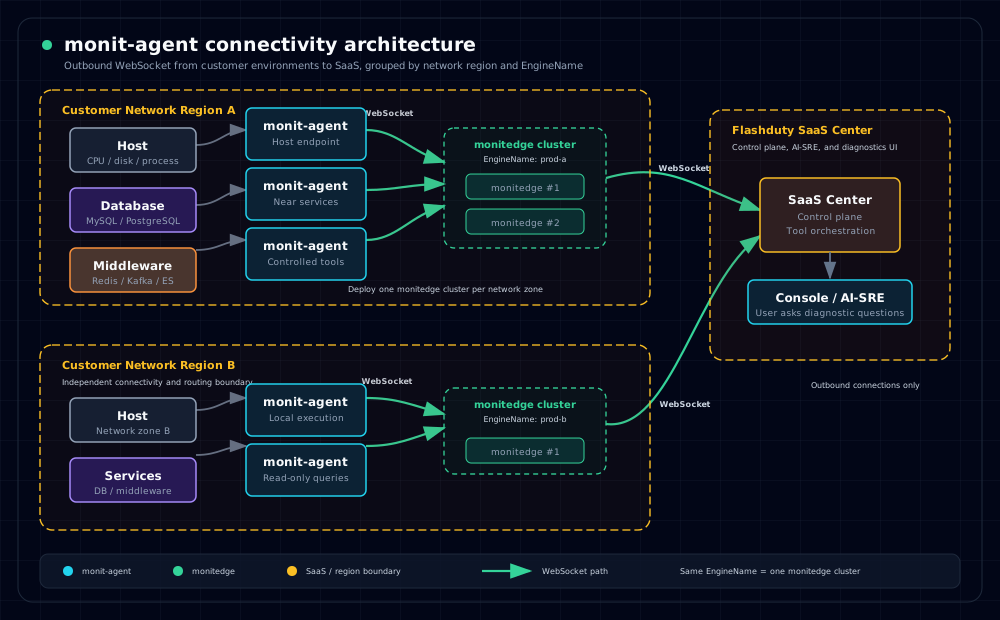
monit-agent connects to monitedge in the same network region over WebSocket. monitedge then connects to the SaaS Center over WebSocket. In most deployments, each network region has one monitedge cluster, and multiple monitedge instances with the same EngineName are treated as one engine cluster.
Supported object types
After
monit-agent is installed and started, at least one host object appears in the console. Other object types appear only after they are configured in agent.yaml.
How objects appear in the console
Monitoring objects do not need to be created manually in the console. Install and startmonit-agent on the target machine. After the Agent successfully connects to Edge, it reports the objects it can diagnose, and the console displays them automatically.
If a new user enters the monitoring object page and sees an empty list, it usually means no Agent has connected successfully. After the first Agent is connected, a host object usually appears first. If you later add MySQL, Redis, PostgreSQL, and other services to the configuration file, the corresponding objects appear automatically.
Recommended onboarding path
1
Install and start monit-agent
Onboard the host object first, confirm that the Agent can connect to Edge, and verify that the current host appears in the console.
2
Configure database and middleware objects
Gradually add MySQL, Redis, PostgreSQL, MongoDB, Kafka, Elasticsearch, and other objects in
agent.yaml.3
Enable controlled query tools as needed
After objects appear, enable controlled query tools such as
mysql.query, redis.command, postgres.query, mongodb.command, and elasticsearch.cat only when needed.Related docs
Install monit-agent
Prepare the Edge address, download the Agent, and start it in the foreground or as a system service.
Configure Monitoring Objects
Configure hosts, databases, middleware, and custom script tools.