

1. Prerequisites
Query Modes
- Query Raw
- Do Stats
Calls
/select/logsql/query interface, returning two-dimensional table data.2. Threshold Evaluation Mode
Both Query Raw and Do Stats query modes can be used. Examples below explain each.2.1 Query Raw Example
Query statement example:
Configure value field as
total, label field as level (or leave empty, Monitors will auto-detect). Different threshold different level configuration examples:
- Warning:
$A.total >= 50or shorthand$A >= 50(since there’s only one value field: total) - Critical:
$A.total >= 100or shorthand$A >= 100(since there’s only one value field: total)
2.2 Do Stats Example
Query statement example:_time:1d and level:ERROR | stats by (level) count(*) total
Result follows Prometheus protocol format:
- Warning:
$A.total >= 50or shorthand$A >= 50(since there’s only one metric field: total) - Critical:
$A.total >= 100or shorthand$A >= 100(since there’s only one metric field: total)
2.3 Recovery Logic
3. Data Exists Mode
This is the most recommended VictoriaLogs alert configuration method, because log scenarios are better suited for “alert when anomalous data exists” mode.
| filter total:>10 filters data with total greater than 10. As long as data rows satisfying this condition are returned, Monitors triggers alert; if no data rows satisfy this condition, alert is considered recovered.
4. No Data Mode
No Data mode is used to monitor “logs that should be continuously generated are no longer appearing”, common scenarios:- Application instance no longer producing logs (possibly process exited)
- Log collection pipeline anomaly (like agent down or output blocked)
Configuration Example
Query statement (Do Stats mode):5. Getting Original Logs During Alert
Alert query conditions typically use “Do Stats” mode, which doesn’t return original logs. Monitors supports configuring “Related Query” in alert rules to additionally query original logs when alert triggers.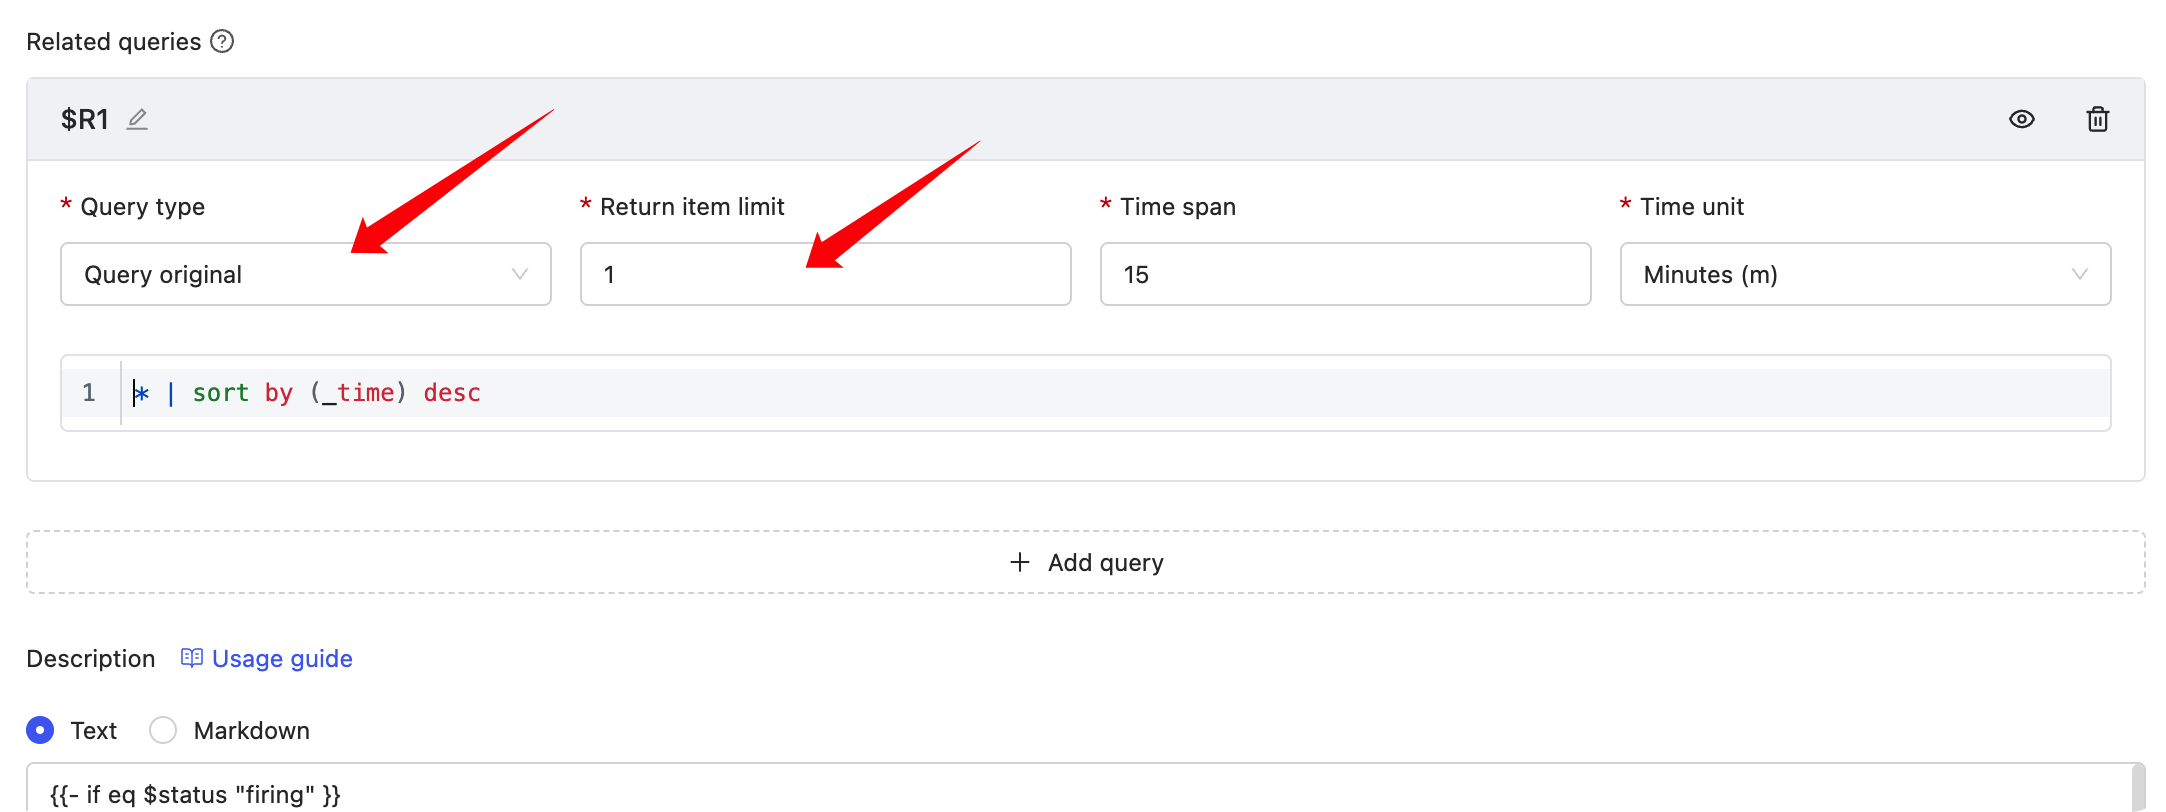 “Related Query” results can be rendered in “Notes Description”, example: